


Last updated: October 10, 2026
Key Takeaways
- If one part of the chain breaks, the other metrics can point you in the wrong direction.
- Use Search Console’s Performance report, then narrow it until one clear story appears.
- On mixed query sets, average position can be misleading, so read it with care.
- Make the result feel like the best answer for that query, not like keyword stuffing.
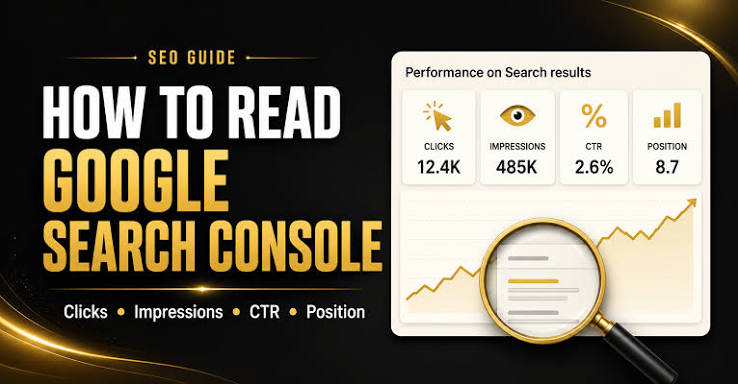
If you want to know whether search traffic is actually improving, track those four metrics in Google Search Console first: impressions, clicks, click-through rate, and average position. This article is about how to track impressions, clicks, CTR, and average position, and the same four metrics are the clearest starting point for most sites. They tell you whether your pages are showing up, getting chosen, and moving up or down in search results.
What each metric means when you are trying to make decisions

If you are using these numbers to decide what to fix next, then treat them as a chain: impressions show visibility, clicks show demand, CTR shows how persuasive the result is, and average position shows where Google usually places you. If one link in that chain breaks, the others can mislead you.
Impressions mean your page appeared in a search result that a user could see. A page can get thousands of impressions and very few clicks if the title and snippet do not pull their weight.
Clicks are straightforward: someone opened your page from search. This is the cleanest sign that search visibility turned into traffic.
CTR is clicks divided by impressions. If a page has 1,000 impressions and 40 clicks, CTR is 4%. That number is useful, but only inside a comparable search context. A branded query, a local query, and a generic informational query behave very differently.
Average position is where your result tends to rank across impressions. I would treat it as a trend line, not a promise, and if the decision affects health, legal, financial, or other high-stakes outcomes, consult a qualified professional and review the current Google Search Console documentation at https://support.google.com/webmasters/answer/7042828. A position of 3.2 does not mean every searcher sees you in spot 3. It means your result averaged around there over the selected date range and query mix.
If you are reporting to a client or boss, say this plainly: impressions and average position are visibility metrics, clicks and CTR are behavior metrics. Mixing them up leads to the wrong fix.
| Situation | Best Path | Why Other Options Fail |
|---|---|---|
| High impressions, low clicks | Improve title tag, meta description, and search intent match | Chasing rank alone will not solve a weak snippet |
| Low impressions, decent CTR | Expand topic coverage or target a broader query set | A prettier snippet cannot help if few people see it |
| Rising impressions, falling CTR | Check SERP changes, featured snippets, and title decay | Average position may look stable while result quality drops |
| Average position improving, clicks flat | Inspect whether the query is branded, local, or informational | Ranking better on the wrong query does not create traffic |
Quick check: if you can explain your page’s problem in one of those four rows, you are using the metrics correctly.
How do I track impressions, clicks, CTR, and average position in Google Search Console?
You track them in the Performance report, then narrow the data until the numbers tell one clear story. Google Search Console is the standard place to start because it shows search data from Google itself, not a guessed estimate from a third-party tool. Google documents this in Search Console Help at https://support.google.com/webmasters/answer/7576553, which is also why it is the best place to verify how impressions, clicks, CTR, and average position are calculated.
If you are new to this, do the following:
- Open Google Search Console and pick the correct property for the site you want to measure.
- Go to Performance and select Search results.
- Make sure the four metrics are turned on: Clicks, Impressions, CTR, and Average position.
- Set a date range long enough to matter. 28 days is a good default; 3 months is better if the site gets low traffic.
- Use the Queries, Pages, Countries, and Devices tabs to isolate one question at a time.
- Compare time periods only when the site has enough volume to make the change meaningful.
- Export the data if you need a clean before-and-after view for a spreadsheet or dashboard.
If the site is small, do not obsess over daily swings. A page with 20 impressions a day can look “up” or “down” just because search demand moved. In that case, 90 days is a safer window than 7 days.
If the site is large, segment first. Mobile and desktop CTR often differ by several points because the results page layout changes. Branded and non-branded queries also need separate treatment, and if the decision is consequential, consult a qualified professional and cross-check the interpretation against Google’s documentation before acting. A page ranking for your company name should not be judged by the same CTR benchmark as a how-to article.
You can also use Google Analytics 4 for downstream behavior after the click, but it does not replace Search Console for these four metrics. GA4 shows sessions, engagement, and conversions; Search Console shows search visibility. For measurement context, Google’s Analytics documentation at https://support.google.com/analytics/answer/10089681 is a useful secondary reference.
For authoritative documentation, I would start with Google Search Console Help and Google’s Search Console performance reporting docs.
Quick check: if you are still staring at the overview screen, you are too broad; move into queries, pages, and a 28-day window.
When average position is the wrong number to trust
If you are looking at a mixed query set, average position can lie to you in a very polite way. It is still useful, but only when you know what kind of search traffic is inside the bucket.
Here is the problem: one page can rank at 1.2 for branded queries and 14.8 for generic queries, then show a blended average that hides both truths. That is why I would never recommend making a content decision from average position alone.
If your average position improved from 18 to 12 but clicks barely moved, then one of three things is usually true:
- The query has low search demand.
- The snippet is weak.
- The search result page is crowded with ads, local packs, videos, or featured snippets.
If the page is informational, a position jump from 11 to 7 can matter a lot. If the page is transactional and the SERP is packed with shopping ads, the same move may do little. Context matters more than the number.
Use this step-by-step path when position is the number you care about:
- Open the page report in Search Console.
- Filter to one page, not the whole site.
- Break out branded and non-branded queries.
- Check device and country separately if the audience is mixed.
- Look at the query list for intent mismatch: informational, commercial, or navigational.
- Compare the result against the actual SERP in an incognito browser or neutral location.
- Decide whether the issue is ranking, snippet appeal, or query fit.
Because the page already has visibility, if your page ranks well but still misses clicks, I would usually rewrite the title before I chase links or add more content. That is not always the answer, but it is often the cheapest fix.
Quick check: if your “average position” changes but your business outcome does not, the metric is probably too blended to guide action.
How do I improve CTR without breaking the page?
You improve CTR by making the result look like the best answer for that query, not by stuffing keywords into the title until it reads like a machine wrote it. If the page already gets impressions, CTR is usually the fastest lever to pull.
Start with the title tag. It has to do three jobs at once: match the query, promise a clear outcome, and avoid sounding generic. A title like “Click-Through Rate Guide” is weak. “How to Improve CTR in Google Search Console” is better because it tells the reader exactly what they get.
If the page is getting impressions but low clicks, use this path:
- Pull the top queries for that page from Search Console.
- Match the title to the dominant intent, not to every edge case.
- Put the most useful promise early in the title, within about 60 characters when possible.
- Write a meta description that adds a reason to click, not a duplicate title.
- Check the live SERP for competing results: featured snippets, sitelinks, local packs, video results, or shopping ads.
- Test one title change at a time for at least 14 days, unless traffic volume is too low to judge quickly.
Do not expect meta descriptions to save a weak result by themselves. Google rewrites them often, and on many searches the title is the real deciding factor. Also, a higher CTR is not always better if you attract the wrong visitor. A flashy title can raise clicks and lower conversions.
I would be especially cautious on pages tied to legal, medical, or financial topics. Those pages should promise accurately, not aggressively. If a subject needs expert review, say so in the content rather than baiting a click.
A useful benchmark is your own historical CTR for the same query type. A 2% CTR might be poor for a page sitting at position 1 on a simple branded query, but perfectly normal for a broad informational query at position 8.
Quick check: if you can get more clicks by making the title clearer, not louder, CTR is the right fix.
The 3 conditions that change everything
If you are not separating these conditions, your tracking will confuse you more than it helps you. Query type, device type, and site size change how impressions, clicks, CTR, and average position should be read.
First, query type. A branded query usually gets high CTR because the searcher already wants you. A non-branded informational query usually gets lower CTR because the searcher is still comparing options. If you compare them directly, the branded result will make everything else look broken.
Second, device type. Mobile SERPs often push results farther down the screen because of ads, local packs, or answer boxes. A desktop average position of 4 may produce a very different click pattern than the same position on mobile.
Third, site size. Big sites can make small ranking changes look important because they have enough impressions to detect tiny shifts. Small sites often need a longer date range before the data means anything. A 7-day view on a low-volume page is often noise.
Here is how I would choose the path:
- If you have brand traffic, split branded and non-branded queries first.
- If you have local intent, filter by country and device before drawing conclusions.
- If you have low volume, use 90 days and focus on trend direction, not daily movement.
- If you have high volume, watch for tiny CTR losses across many pages; those can matter at scale.
This is also where third-party rank trackers can help, but only as a supplement. Tools like Semrush, Ahrefs, and SE Ranking estimate rankings differently from Search Console. They are useful for monitoring competitors or keyword groups, but they do not replace the actual click and impression data from Google. For broader SEO measurement guidance, see Google’s own documentation and the reporting notes from Search Console.
Quick check: if you are judging a brand page and a non-brand page by the same standard, your measurement setup is off.
Edge cases where the normal advice breaks down
If any of these situations describe your site, then the usual advice needs a detour. These are the cases where people chase the wrong metric for weeks.
-
You rank in a featured snippet.
What changes: impressions can rise while clicks flatten, because the answer appears before the click.
What to do instead: compare the page’s CTR before and after the snippet appeared, then decide whether to optimize for visibility or click-through. Sometimes the win is branding, not traffic. -
Your query triggers a local pack or shopping results.
What changes: organic average position can look fine, but your result sits below paid and map-heavy blocks.
What to do instead: measure by device and location, then compare against the actual SERP layout. If local intent is the real game, Google Business Profile and local landing pages may matter more than the page itself. -
Your site gets very low search volume.
What changes: one new impression can swing CTR wildly.
What to do instead: use 60 to 90 days of data and avoid overreacting to single-week changes. -
You changed a title tag recently.
What changes: CTR may improve or drop within days, but average position may lag or move for unrelated reasons.
What to do instead: isolate the page, note the change date, and compare like-for-like periods. -
You have multiple pages targeting the same query.
What changes: impressions and clicks split across pages, and average position gets messy.
What to do instead: consolidate or clarify page intent. Otherwise, the data will keep arguing with itself. -
Your site depends on news or seasonal demand.
What changes: impressions and clicks rise because the topic is hotter, not because SEO improved.
What to do instead: compare the same season year over year if you have enough history.
Quick check: if a page looks “better” but the SERP itself changed, your tracking problem may be search layout, not SEO.
What I would monitor each week and each month
If you want a practical cadence, then track weekly for movement and monthly for decisions. Weekly numbers catch changes early; monthly numbers are better for action.
Each week, I would review:
- top pages by clicks
- pages with high impressions and low CTR
- pages with rising average position but flat clicks
- query groups that changed after a title or content update
Each month, I would review:
- Branded versus non-branded performance.
- Top 20 pages by organic clicks.
- Pages with 1,000+ impressions and CTR below your normal range.
- Queries that moved from page 2 to page 1.
- Device split and country split.
- Conversion behavior in GA4 after the click.
If you need one clean rule, use this: impressions tell you where to invest, CTR tells you what to rewrite, clicks tell you what the market accepted, and average position tells you whether Google is still giving you enough visibility to matter.
Drafted with AI; not yet reviewed by a person.




Leave a comment